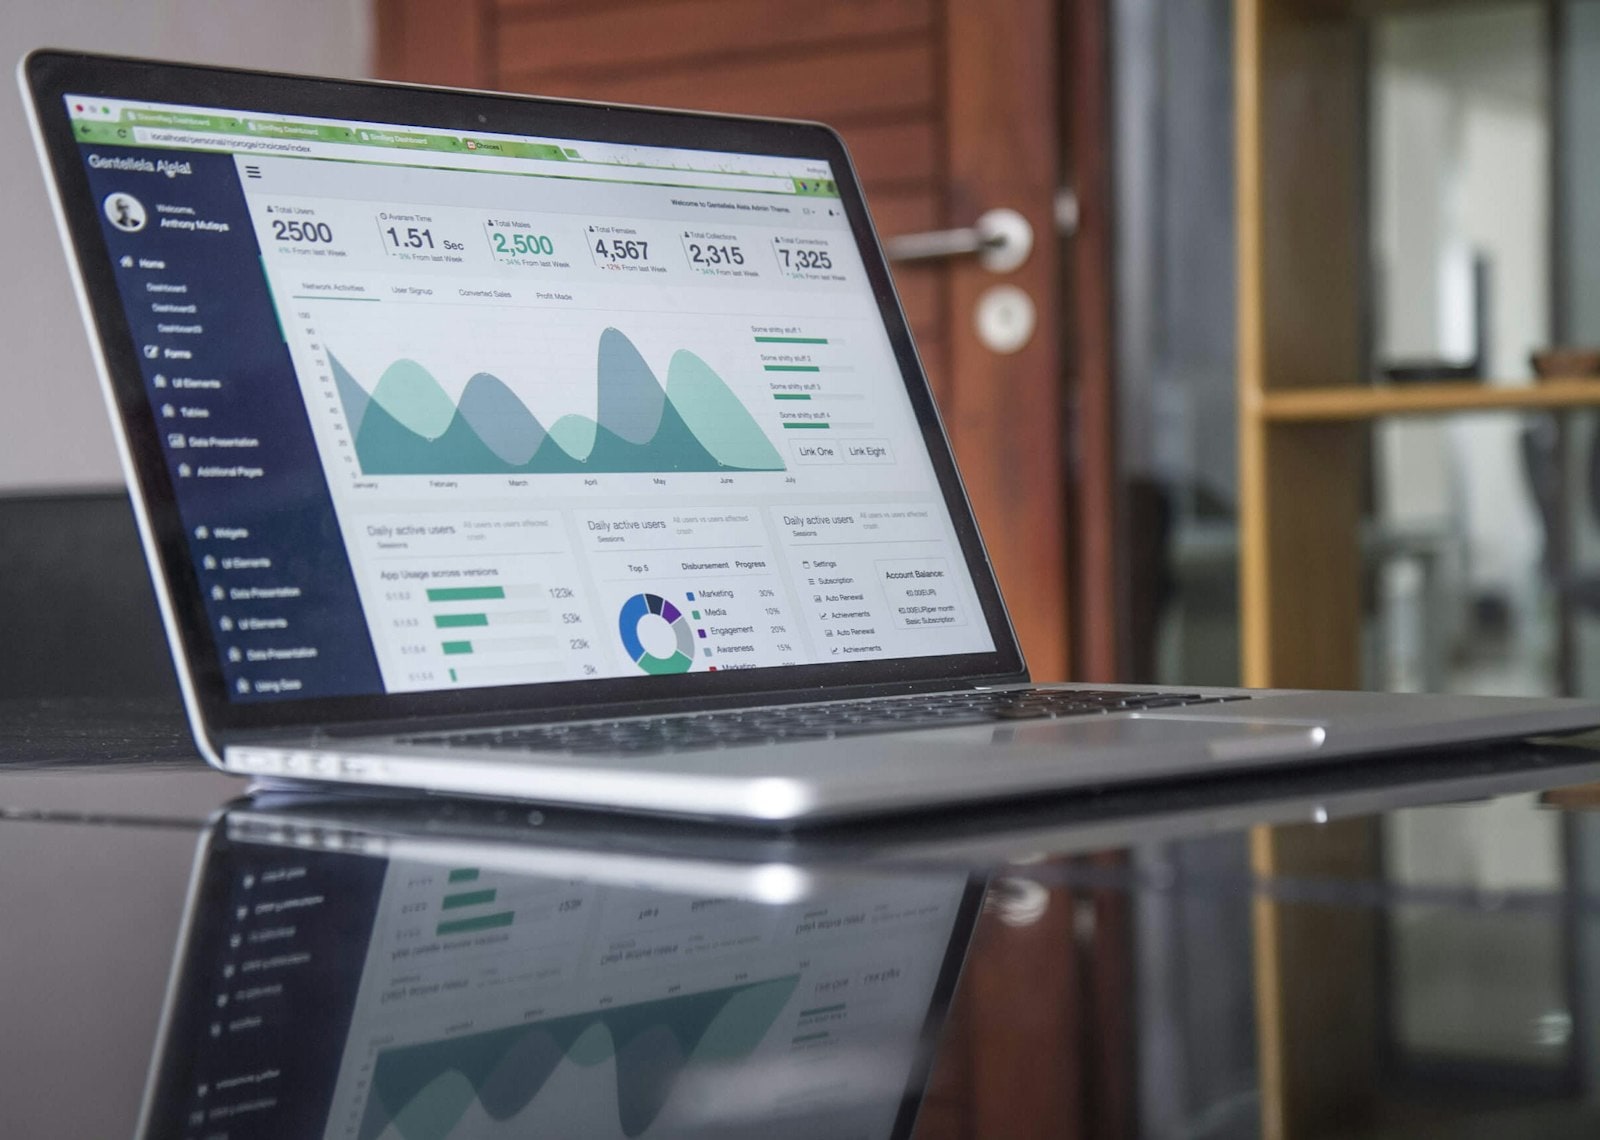
Dashboards are only as good as the data behind them. A data pipeline collects information from operational systems, cleans and combines it, and delivers it in a form people can trust.
ETL vs. ELT
ETL: extract, transform, load
Data is transformed before it lands in the warehouse. This was common when storage and compute were expensive.
ELT: extract, load, transform
Raw data is loaded first and transformed inside the warehouse using SQL. Modern cloud warehouses make this approach flexible: raw data is kept, and transformations can be changed and re-run.
The layers of a pipeline
- Ingestion: connectors or change-data-capture pull data from applications and databases.
- Raw layer: an untouched copy of source data for traceability.
- Clean layer: types fixed, duplicates removed, naming standardised.
- Business layer: models that reflect business concepts such as customers, orders and revenue.
- Consumption: dashboards, reports, exports and machine-learning features.
Data quality is a feature
- Test for nulls, duplicates and unexpected values on every run
- Alert when data arrives late or row counts change unexpectedly
- Document where each metric comes from and how it is calculated
Batch or streaming?
Most reporting works well with hourly or daily batches. Streaming is worth its extra complexity when decisions genuinely depend on data that is seconds or minutes old, such as fraud checks or live operations dashboards.
Agree on metric definitions first. A fast pipeline that produces numbers nobody trusts is still a failed pipeline.
- Data Engineering
- ETL
- Analytics